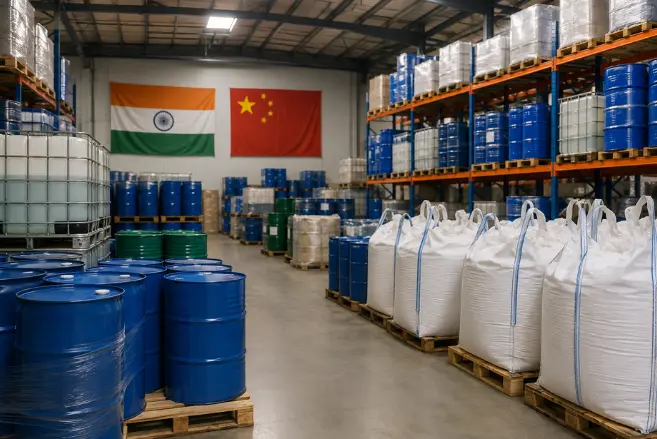
A procurement director at a mid-size coatings manufacturer received a straightforward request from her CFO in late 2025: provide the Scope 3 carbon footprint for the company’s top ten chemical raw materials before the annual sustainability report deadline. She had six weeks, no lifecycle assessment budget, and suppliers ranging from large public companies to small private factories in Gujarat and Shandong. The question was not whether her company cared about carbon. The question was what data actually existed and what she could realistically report.
This situation is increasingly common for procurement teams working with bulk chemical suppliers. ESG disclosure is moving from aspirational to mandatory in most large industrial supply chains, and purchased chemicals are Scope 3 emissions. But the gap between what boards ask procurement to report and what procurement can actually measure remains wide. This guide covers what is genuinely measurable today, what will require longer-term supplier development, and what a procurement team can do without an LCA consultant or a six-figure sustainability platform.
Why Chemical Procurement Teams Are Being Asked About Carbon Right Now
The pressure is coming from three directions simultaneously, and each one has a specific deadline attached.
Customer requirements. Major manufacturers in automotive, consumer products, and electronics have made net-zero commitments and are now pushing Scope 3 data requirements down their supply chains. A coatings manufacturer supplying an automotive OEM with a 2030 net-zero target will receive supplier questionnaires asking for product carbon footprint (PCF) data. That coatings manufacturer then needs the same data from its chemical raw material suppliers.
The EU Carbon Border Adjustment Mechanism (CBAM). The Carbon Border Adjustment Mechanism is not a future policy. Phase 1 is operational. From October 2023, EU importers of covered goods have been required to report embedded carbon in imports. The current covered categories are cement, iron and steel, aluminum, fertilizers, electricity, and hydrogen. Expansion to downstream chemical categories is under active EU legislative review. For procurement teams sourcing chemicals for EU-market products, understanding the carbon intensity of supply is now a compliance preparation activity, not just a reporting exercise.
Board-level ESG KPIs. Sustainability commitments at the group level are translating into procurement KPIs. Supplier carbon disclosure rate, percentage of spend from suppliers with verified emission reduction targets, and Scope 3 Category 1 emission estimates are becoming procurement metrics alongside cost savings and delivery performance. Procurement teams that have not started building the data infrastructure will be behind when these metrics are formalized.
Understanding Scope 3 Emissions in Chemical Procurement
Most procurement teams are familiar with the concept but uncertain about what falls where and what they are actually responsible for measuring.
Under the GHG Protocol framework, Scope 1 covers direct emissions from owned operations, Scope 2 covers purchased electricity and heat, and Scope 3 covers all indirect value chain emissions. For a manufacturer purchasing chemicals, those chemicals fall under Scope 3 Category 1: Purchased Goods and Services. This is typically the largest single Scope 3 category for chemical-intensive manufacturers, often representing 60–80% of total Scope 3 emissions.
The critical distinction for procurement: Scope 3 Category 1 represents the emissions embedded in making the chemicals you buy. Your suppliers’ Scope 1 and 2 emissions become your Scope 3 Category 1. This means procurement decisions about which supplier to use, which origin to source from, and which product specification to specify all directly affect your Scope 3 footprint.
What procurement can influence: supplier selection (choosing suppliers with lower emission intensity), origin selection (same chemical produced from different energy sources has different carbon intensity), transport mode and route, and product specifications (sometimes a less energy-intensive chemical can meet the same application requirement). What procurement realistically cannot change in the short term: the energy infrastructure of an existing supplier’s manufacturing site, or the grid mix in the country where that supplier operates.
Carbon Intensity Varies More Than Most Procurement Teams Realize
The same chemical, produced in different regions, can have dramatically different carbon intensity per metric tonne of output. This is driven primarily by energy source differences in manufacturing, not by process differences.
China’s electricity grid is approximately 60–65% coal-powered. Energy-intensive chemical manufacturing in China, particularly electrolytic processes (chlorine, caustic soda, aluminum compounds) and high-temperature synthesis routes, has significantly higher carbon intensity per MT than equivalent production in regions with lower-carbon energy mixes. India’s grid is mixed (approximately 50–55% coal in 2026, declining as renewables expand). The Middle East produces many base chemicals from associated natural gas, a lower-carbon feedstock than coal. European chemical manufacturers in the Netherlands, Germany, and Belgium increasingly access renewable electricity, and several have committed to specific emissions reduction targets with verified data.
Chemical Category | China (coal grid) | India (mixed grid) | Middle East (gas-based) | Europe (mixed renewables) |
Caustic soda / chlorine (electrolytic) | Very high | High | Medium | Medium-low |
Commodity solvents (petrochemical) | High | Medium-high | Medium | Medium |
Ammonia / urea (gas-based) | Medium (gas origin) | Medium | Low-medium | Medium |
Titanium dioxide | Medium | Medium | N/A | Medium-low |
Specialty organics (synthesis) | Medium-high | Medium | Varies | Medium |
These are relative estimates, not verified LCA data. For precise figures, product-specific lifecycle assessments are required. But the directional pattern is reliable: energy-intensive chemicals from coal-heavy grids carry higher embedded carbon per MT than equivalent products from gas-based or renewable energy-intensive production. Categories such as water treatment chemicals — which rely heavily on caustic soda, chlorine, and aluminum sulfate — are among those where origin selection can produce the largest measurable difference in Scope 3 Category 1 emissions.
Shipping adds measurable carbon. Container ships emit approximately 10–40 grams of CO2 per tonne-kilometer depending on vessel efficiency and load factor. For a chemical shipped from Shanghai to Rotterdam (approximately 20,000 km via Cape of Good Hope rerouting), this adds roughly 200–800 kg CO2 per MT. From Mumbai to Rotterdam (approximately 10,500 km), the shipping contribution is roughly half. Shorter trade lanes, all else equal, carry lower transport carbon.
What Data You Can Realistically Obtain from Chemical Suppliers
The data landscape is uneven. Mature suppliers to EU and US regulated markets have invested in sustainability reporting infrastructure. Many others have almost nothing to offer beyond an ISO 14001 certificate that says little about actual emission levels.
Tier 1: Ask Every Supplier (Should Be Available)
These data points should be requested in every new supplier RFQ and at annual review:
- ISO 14001 environmental management system certification (indicates systematic management of environmental impacts; does not quantify them)
- Responsible Care membership (particularly relevant for European and North American chemical manufacturers)
- Basic energy source disclosure: does the site use grid electricity, gas, coal, or renewables as primary energy? A simple statement, not a full carbon calculation
Tier 1 data is a process indicator, not an emissions measurement. It tells you the supplier has environmental management systems in place but does not tell you the carbon intensity of the product you are buying.
Tier 2: Available from Sustainability-Mature Suppliers
Larger exporters, listed companies, and suppliers with European customers are increasingly able to provide:
- EcoVadis sustainability rating or equivalent (ThinkStep, Sedex) — a third-party assessed score covering environment, labor, ethics, and supply chain practices
- Product Carbon Footprint (PCF) data in kg CO2 equivalent per MT, covering at minimum Scope 1 and 2 manufacturing emissions
- GHG Protocol Scope 1 and 2 annual disclosure for the relevant manufacturing site
PCF data at Tier 2 is becoming available from major Indian and Chinese exporters who supply European buyers. It requires supplier investment and is not yet universal, but requesting it creates the incentive for suppliers to develop it.
Tier 3: Available from Leading Suppliers or Requiring Commissioned LCA
Full lifecycle assessment data, Science Based Targets (SBTi) commitments, and CDP Climate disclosure (covering Scope 3 as well as Scope 1 and 2) represent the leading edge of chemical supplier sustainability reporting. Fewer than 10% of chemical suppliers globally can provide this level of data, but the proportion is growing among listed companies and large-volume exporters.
For procurement teams that need verifiable Scope 3 data for external reporting, Tier 3 data is the target. Getting there from a current baseline of Tier 1 suppliers may take 2–3 years of supplier engagement, and for some categories with fragmented or private manufacturing bases, it may require commissioning an industry average LCA to use as a default estimate.
The EU Carbon Border Adjustment Mechanism: What Chemical Buyers Need to Know Now
CBAM is the most immediately actionable regulatory development for European chemical importers and for non-EU suppliers into European markets.
Phase 1 (reporting only, no financial liability): October 2023 to December 2025. EU importers of covered goods were required to report embedded emissions in their imports quarterly. The primary categories: cement, iron and steel, aluminum, fertilizers, electricity, and hydrogen.
Phase 2 (financial liability begins): January 2026 onward. EU importers must purchase CBAM certificates equivalent to the carbon price that would have been paid under the EU Emissions Trading System (EU ETS) if the goods had been produced in the EU. The carbon certificate price tracks the EU ETS spot price, which has ranged from roughly €45 to €100 per tonne of CO2e.
For chemical procurement specifically: fertilizers (including ammonia and urea) and hydrogen are in scope now. The EU is actively evaluating expansion to cover broader organic and inorganic chemical categories as part of the CBAM scope review. Procurement teams sourcing these categories into European markets need supplier-level embedded carbon data to calculate CBAM liability accurately. Suppliers who cannot provide verified carbon intensity data will generate a default calculation based on industry averages, which is typically less favorable.
Practical preparation steps for EU-bound chemical procurement: identify which purchased categories are currently or likely to come under CBAM scope, request carbon intensity data from suppliers of those categories, and build a basic CBAM liability estimate into your total cost of ownership model for European-market raw materials.
Practical First Steps for Procurement Teams
The gap between where most procurement teams are today and where a mature Scope 3 emissions program needs to be is real. The following sequence focuses on what delivers useful data without requiring an LCA consultant or large budget investment.
Step 1: Map your top five spend categories. Identify which purchased chemicals represent your highest Scope 3 exposure by volume and carbon intensity (energy-intensive, high-volume categories first: basic inorganics, commodity solvents, ammonia derivatives). These will be the most material in any Scope 3 Category 1 calculation.
Step 2: Add a carbon disclosure question to your standard RFQ. A single question (“please provide your site’s ISO 14001 certification status and any available product carbon footprint data for this material”) adds nothing to RFQ administration time and begins building the supplier disclosure expectation. Collect whatever is available; do not disqualify suppliers for lack of data in year one.
Step 3: Prefer suppliers with ISO 14001 and EcoVadis scores as a proxy. Where PCF data is not available, ISO 14001 and EcoVadis scores are the best available proxies for environmental management maturity. EcoVadis environmental scores specifically assess energy and emissions management. They are not an emissions measurement, but suppliers with strong EcoVadis scores are more likely to have the data infrastructure to generate PCF data when requested.
Step 4: Build carbon data fields into your supplier scorecard. Carbon intensity data and disclosure status should appear alongside quality, lead time, and price in your supplier evaluation framework. For procurement teams under external ESG reporting pressure, knowing which suppliers can provide carbon data is itself a supply chain risk assessment.
For procurement teams managing sodium salts and other electrolytic inorganic chemicals, the origin selection decision carries the largest carbon intensity impact of any procurement category, given the coal-power dependency of Chinese electrolytic production versus lower-carbon alternatives.
Step 5: Factor shipping distance into your carbon baseline. For categories where you have a choice between Asian origins, shorter trade lanes reduce transport emissions. For high-volume commodity chemicals with equivalent quality profiles across origins, transport carbon is a relevant differentiator and is increasingly required in Scope 3 transport and distribution calculations.
Sourcing Bulk Chemicals Through Raw Source
The carbon footprint challenge in chemical procurement is, at its core, a supplier visibility challenge. Procurement teams cannot report or improve Scope 3 Category 1 emissions without supplier-level data on how their chemicals are made and what energy goes into making them. For teams sourcing directly from dozens of manufacturers across multiple countries, building that data infrastructure individually is a significant undertaking.
Raw Source’s role in the sourcing chain provides practical carbon visibility advantages for procurement teams working under ESG reporting obligations.
For procurement teams sourcing through Raw Source, the supplier network in India and China has been pre-qualified for quality, documentation, and regulatory compliance. As sustainable chemical sourcing standards rise, Raw Source’s supplier qualification process is evolving to include environmental management system status as a standard criterion. Suppliers with ISO 14001 certification and EcoVadis assessments are prioritized in category recommendations for EU-market buyers where carbon disclosure requirements are most pressing.
On the question of origin and carbon intensity: Raw Source sources across both India and China, and for categories where origin selection has a material effect on embedded carbon (energy-intensive inorganic chemicals, where India’s less coal-heavy grid creates a differential), this information is available to procurement teams as part of a category-level sourcing discussion. For buyers with specific Scope 3 reduction targets, understanding origin-level carbon intensity differences is a concrete input to supplier selection decisions that a sourcing partner with multi-origin visibility can help provide.
On EU CBAM compliance specifically: Raw Source handles export documentation across India and China origins for a wide range of chemical categories. For fertilizer-category products currently within CBAM scope, and for categories that may come under future scope reviews, Raw Source’s documentation team can support importers in collecting the supplier carbon intensity data that CBAM compliance requires. Customs documentation for EU-bound shipments already includes the product specification and origin data needed as the foundation for CBAM reporting; the additional step is ensuring suppliers can provide the embedded carbon figures.
For procurement teams in early stages of Scope 3 data collection, Raw Source can provide current sourcing context for the categories in your portfolio: which origins are available, which suppliers have or are developing PCF data, and what the carbon intensity differential looks like in practice for your specific categories. This is more useful as a starting point than a theoretical carbon mapping exercise, because it is grounded in the actual supplier pool available for your volume and specification requirements.
To discuss your chemical portfolio’s ESG data requirements and how origin selection can factor into your Scope 3 reporting, request a bulk quote that includes the origin and supplier profile information needed for your sustainability reporting baseline.
Frequently Asked Questions
What is Scope 3 emissions in chemical procurement?
Scope 3 emissions in chemical procurement refers to the greenhouse gas emissions embedded in the chemicals you purchase, categorized under Scope 3 Category 1 (Purchased Goods and Services) of the GHG Protocol framework. Your suppliers' manufacturing emissions (their Scope 1 and 2) become your Scope 3 Category 1. For chemical-intensive manufacturers, this category typically represents 60–80% of total Scope 3 emissions and is often the largest single emissions category in the value chain.
How does the EU Carbon Border Adjustment Mechanism affect chemical importers?
The CBAM requires EU importers of covered goods to report embedded carbon in those imports and, from January 2026, to purchase CBAM certificates equivalent to the EU ETS carbon price for the embedded emissions. Currently covered categories include fertilizers, hydrogen, cement, iron and steel, aluminum, and electricity. Expansion to cover broader chemical categories is under EU review. EU importers of in-scope chemicals need verified carbon intensity data from their suppliers to calculate CBAM liability accurately; without supplier data, a default (typically less favorable) average is applied.
How do I get carbon footprint data from chemical suppliers?
Start by requesting ISO 14001 certification status and any available Product Carbon Footprint (PCF) data in your standard RFQ. Larger suppliers with European customers are increasingly able to provide PCF data in kg CO2e per MT. For smaller or less sustainability-mature suppliers, ISO 14001 and EcoVadis environmental scores are the best available proxies. Full lifecycle assessment data is available from fewer than 10% of chemical suppliers globally; for most procurement teams, Tier 1 and Tier 2 data collection is the realistic near-term target.
Does sourcing from India vs China make a meaningful difference to supply chain carbon footprint?
Yes, for energy-intensive chemical categories. China's electricity grid is approximately 60–65% coal-powered, making electrolytic and high-temperature synthesis processes significantly more carbon-intensive per MT than equivalent production in regions with lower-carbon energy mixes. India's grid is mixed (approximately 50–55% coal) and improving. The Middle East produces gas-based chemicals with lower carbon intensity for many categories. Europe has the most mature renewable energy integration. For energy-intensive inorganic chemicals (caustic soda, chlorine, aluminum compounds), the origin difference in carbon intensity can be 2–3x, which is material for Scope 3 reporting purposes.
What certifications prove a chemical supplier has genuine environmental credentials?
ISO 14001 (environmental management system) indicates systematic management of environmental impacts but does not quantify them. EcoVadis environmental scores assess energy, emissions, water, and materials management in a third-party-verified framework and are increasingly required by European buyers. Responsible Care certification is relevant for chemical manufacturers in ICCA member countries. Science Based Targets (SBTi) commitments and CDP Climate disclosure are the most rigorous indicators of genuine emissions reduction ambition, but fewer than 10% of chemical suppliers globally have achieved these levels of transparency.
Is shipping chemicals by sea more carbon-efficient than by air freight?
Yes, substantially. Sea freight emits approximately 10–40 grams of CO2 per tonne-kilometer; air freight emits approximately 500–600 grams per tonne-kilometer, making air roughly 15–50x more carbon-intensive per unit transported. For bulk chemical procurement, air freight is typically not viable on cost grounds anyway. Within sea freight, shorter routes carry lower transport emissions; the Red Sea rerouting around the Cape of Good Hope adds approximately 3,500–4,000 km to Asia-Europe voyages, increasing voyage emissions by roughly 10–15% compared to Suez Canal routing.